videoly for brands
Part 2. Delivering video level analytics
Period
2019–2023
Role
Senior Product Designer
Context
In 2019, Videoly successfully launched a new product onto the market. From the early stages of the MVP, the need to display data as video performance on retailer pages was evident.
Problem
Uncertainty in content effectiveness
One of the primary concerns of customers is to enhance their conversion rate. Brands encounter difficulties in identifying which videos generate higher engagement and impact the sales of their products. This lack of certainty makes it challenging to plan marketing strategies and may result in the wastage of resources.
Reporting for managers
Content managers need to report on the effectiveness of video content. This requires significant efforts in communicating with retailers, collecting, and analyzing big amount of data.
Solution
Provide users with an understanding of how Videoly distributes their video content. Develop a section with key analytics and demonstrate how video content performs. Enable data export and download reports in a PDF file format.
Process
Designing dashboard
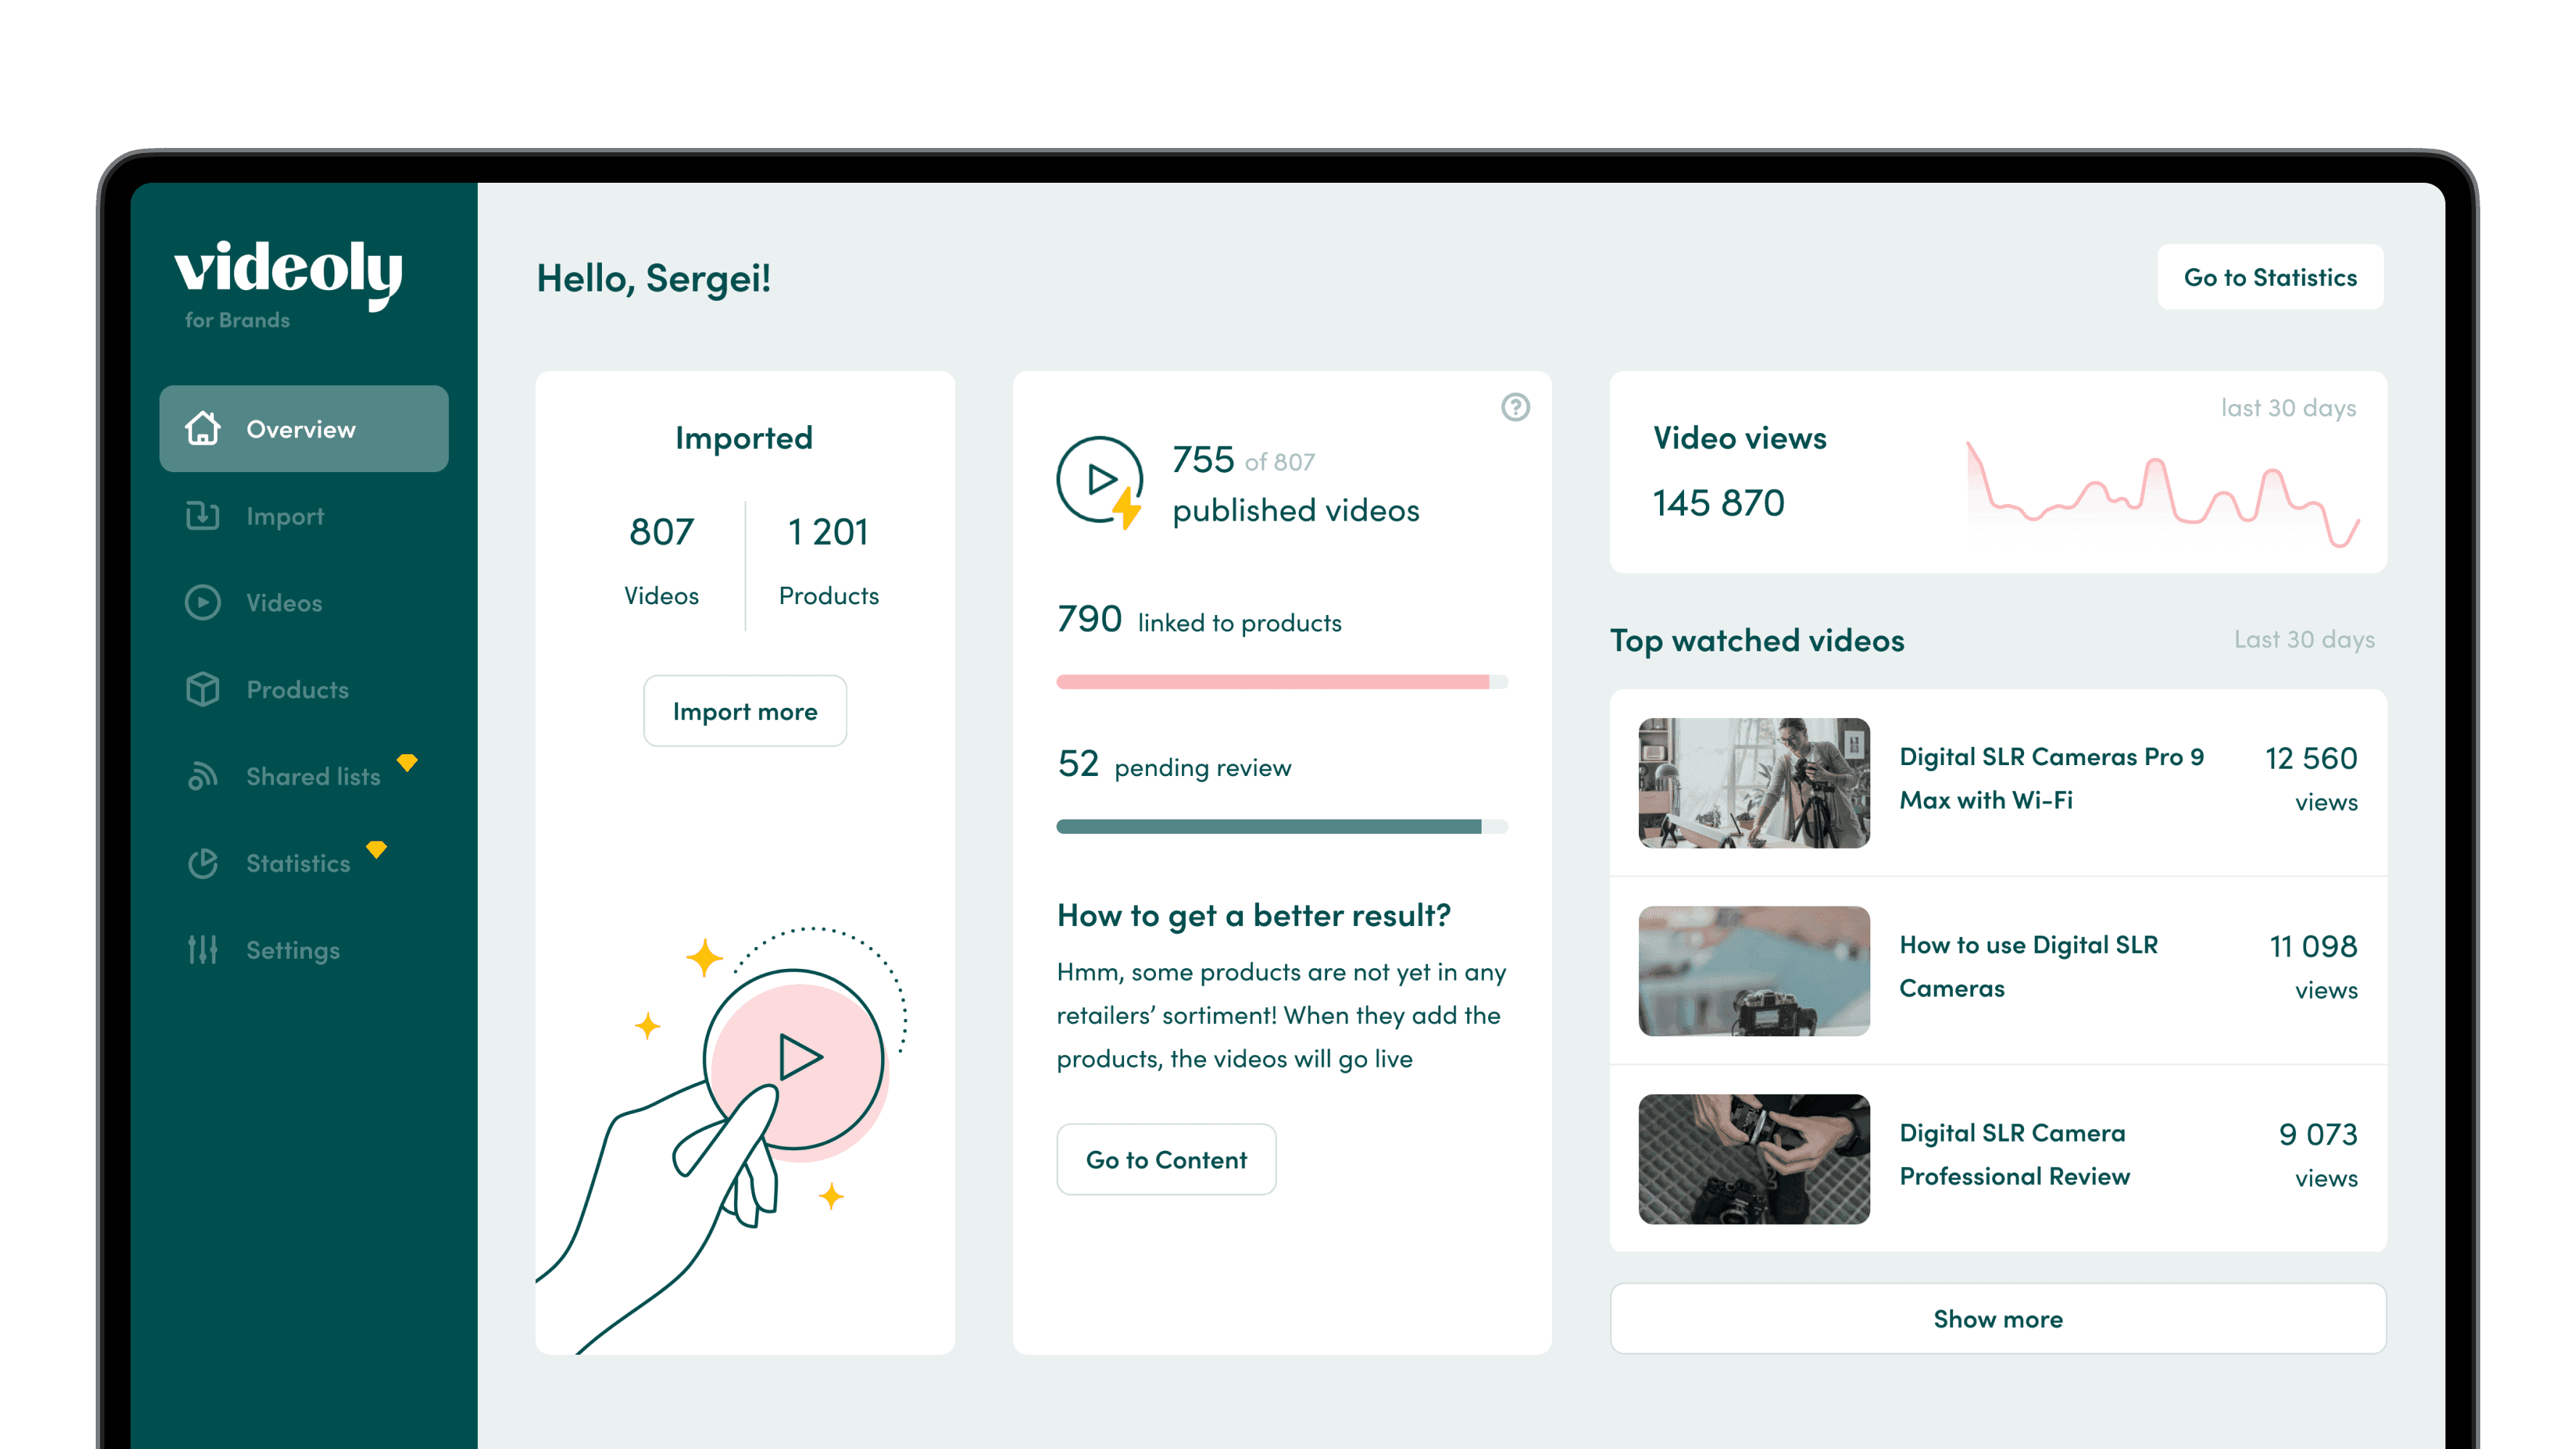
During the MVP stage, we provided basic data on the dashboard: the number of imported content, the number of published videos, and video views.
MVP
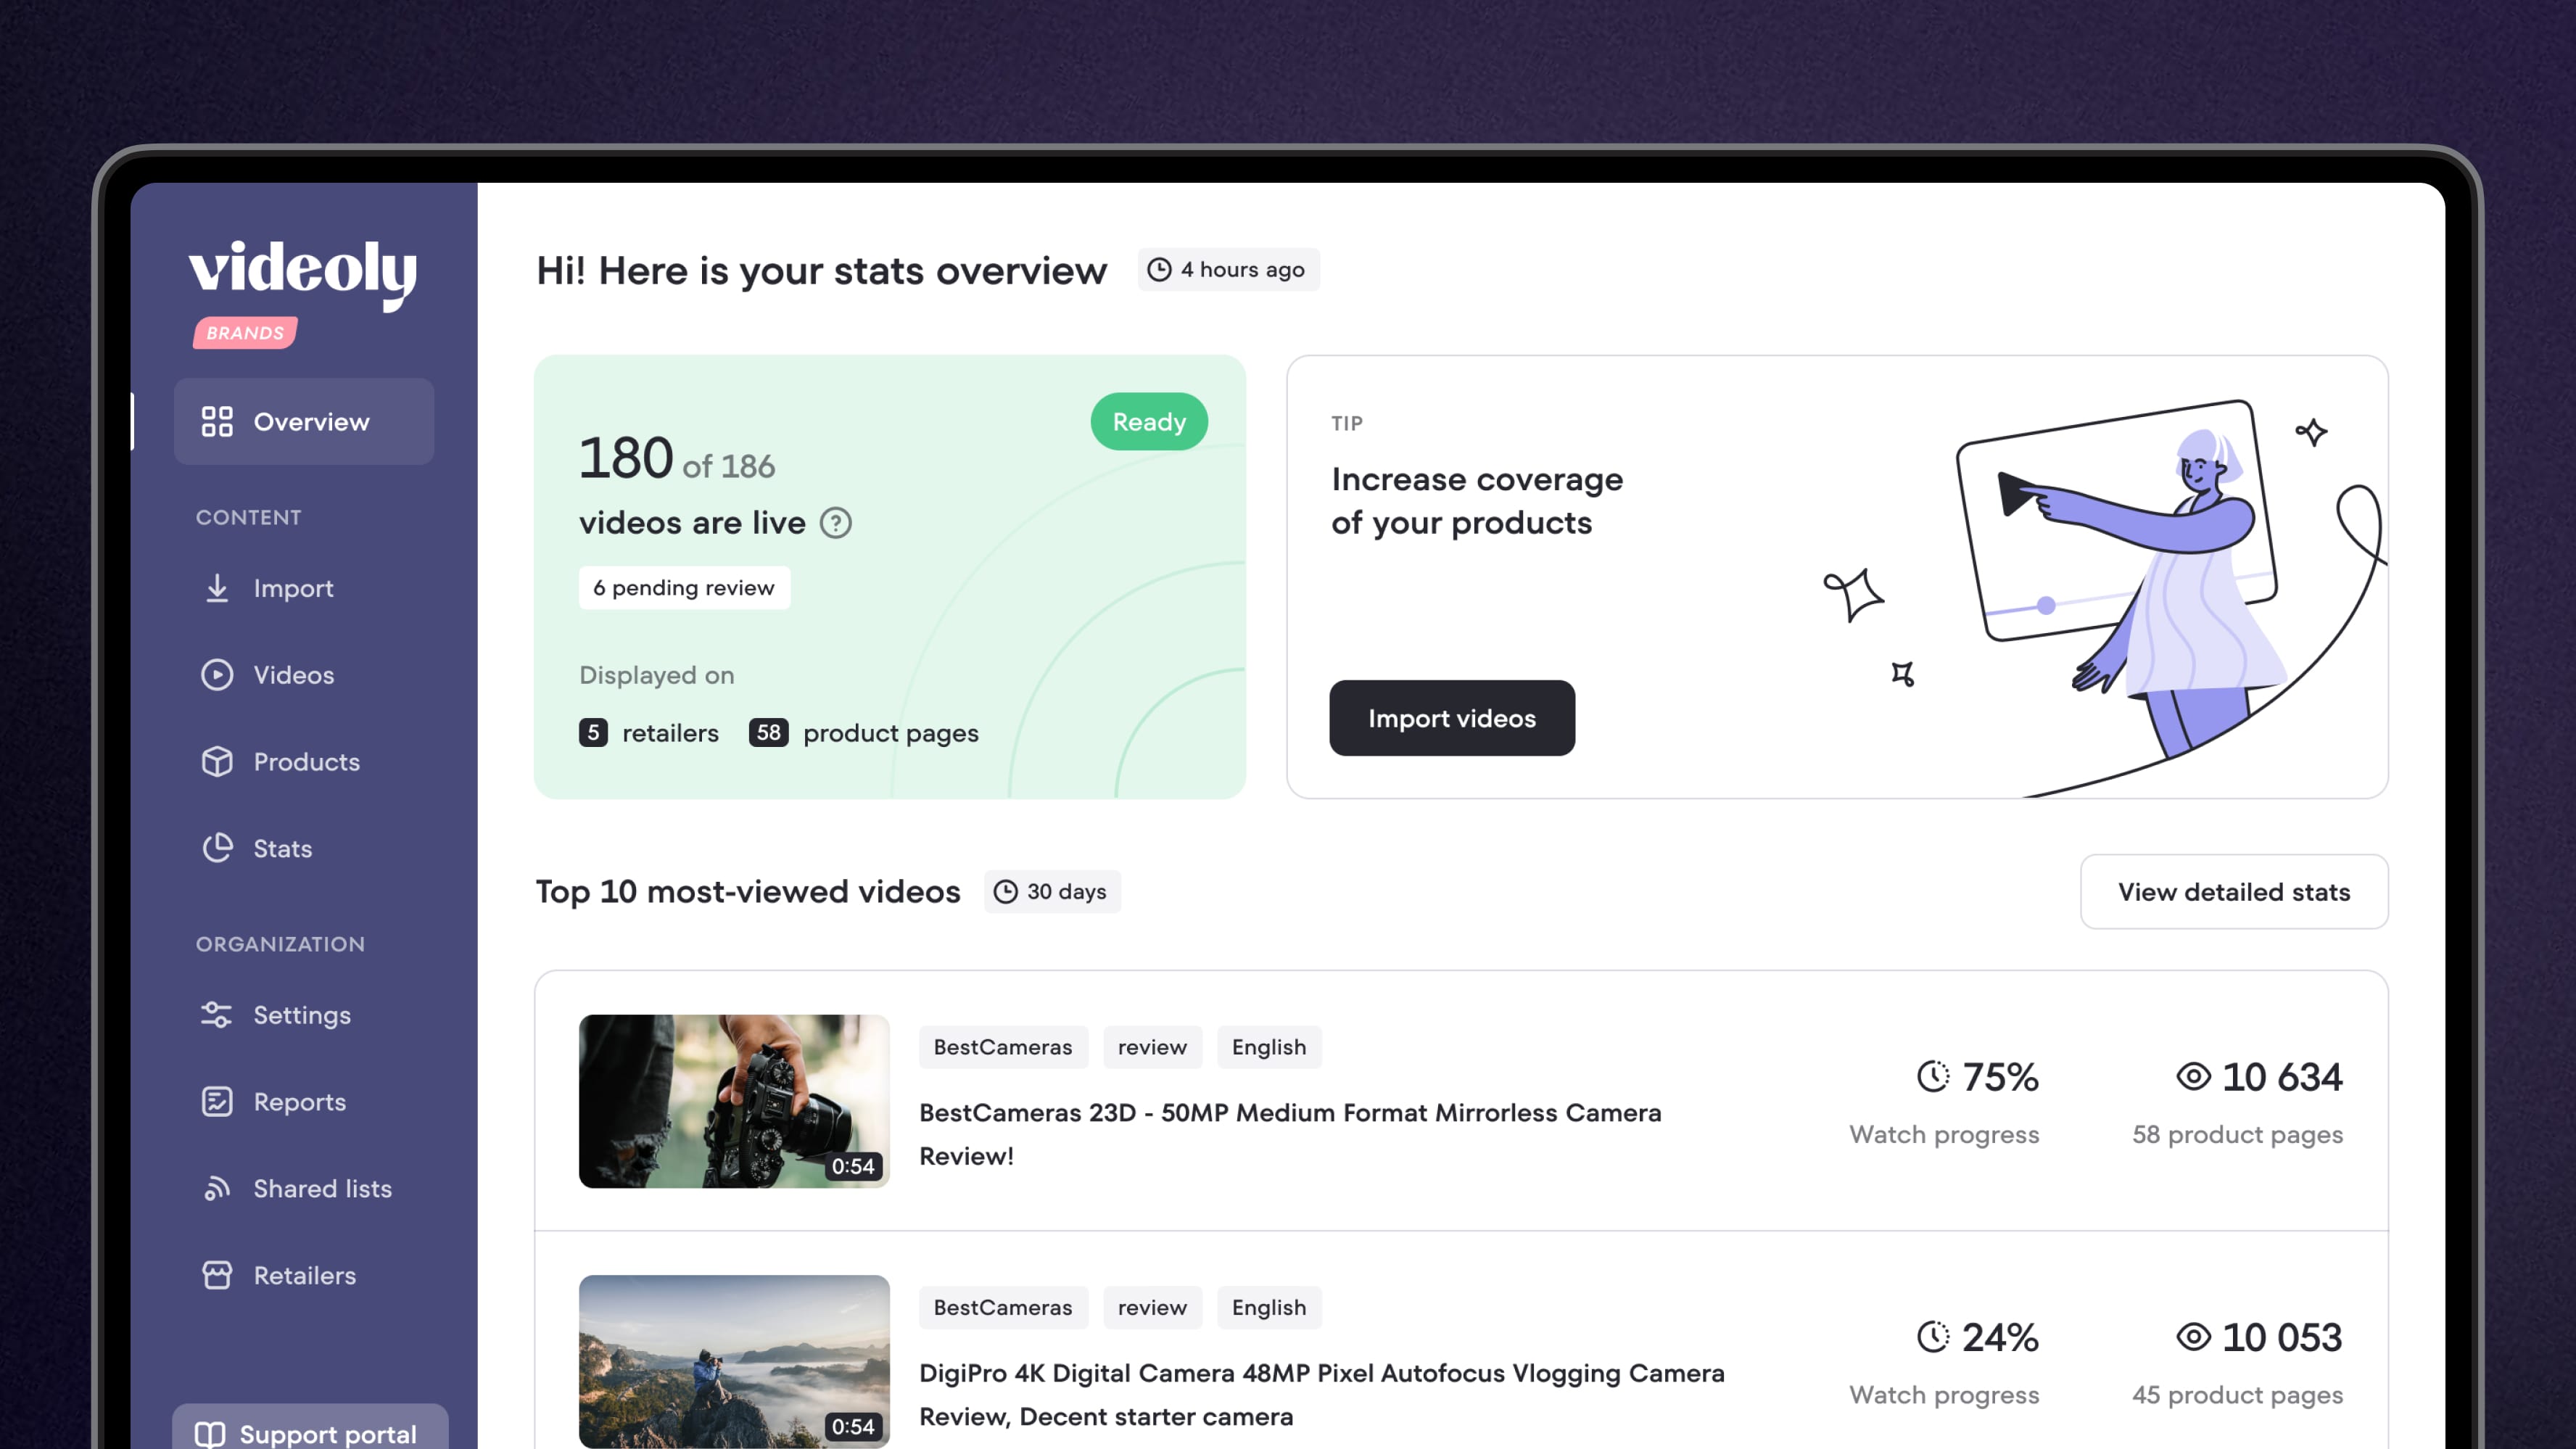
Later, we conducted research and decided to enhance the dashboard. The main task was to provide users with an understanding of what happens with video content within the system and on retailer pages.
I designed a dashboard consisting of several blocks that answer questions:
✦ What are the most viewed videos?
✦ How to get better results?
✦ How many videos are displayed on product pages?
Some videos remained unviewed for several reasons, including being unpublished or not linked with products. Therefore, we decided to provide users with tips on what needs to be done with the content to get it published and displayed in the video widget on retailer product pages. The blocks with tips lead directly to the list of videos with a filter applied based on the video status.
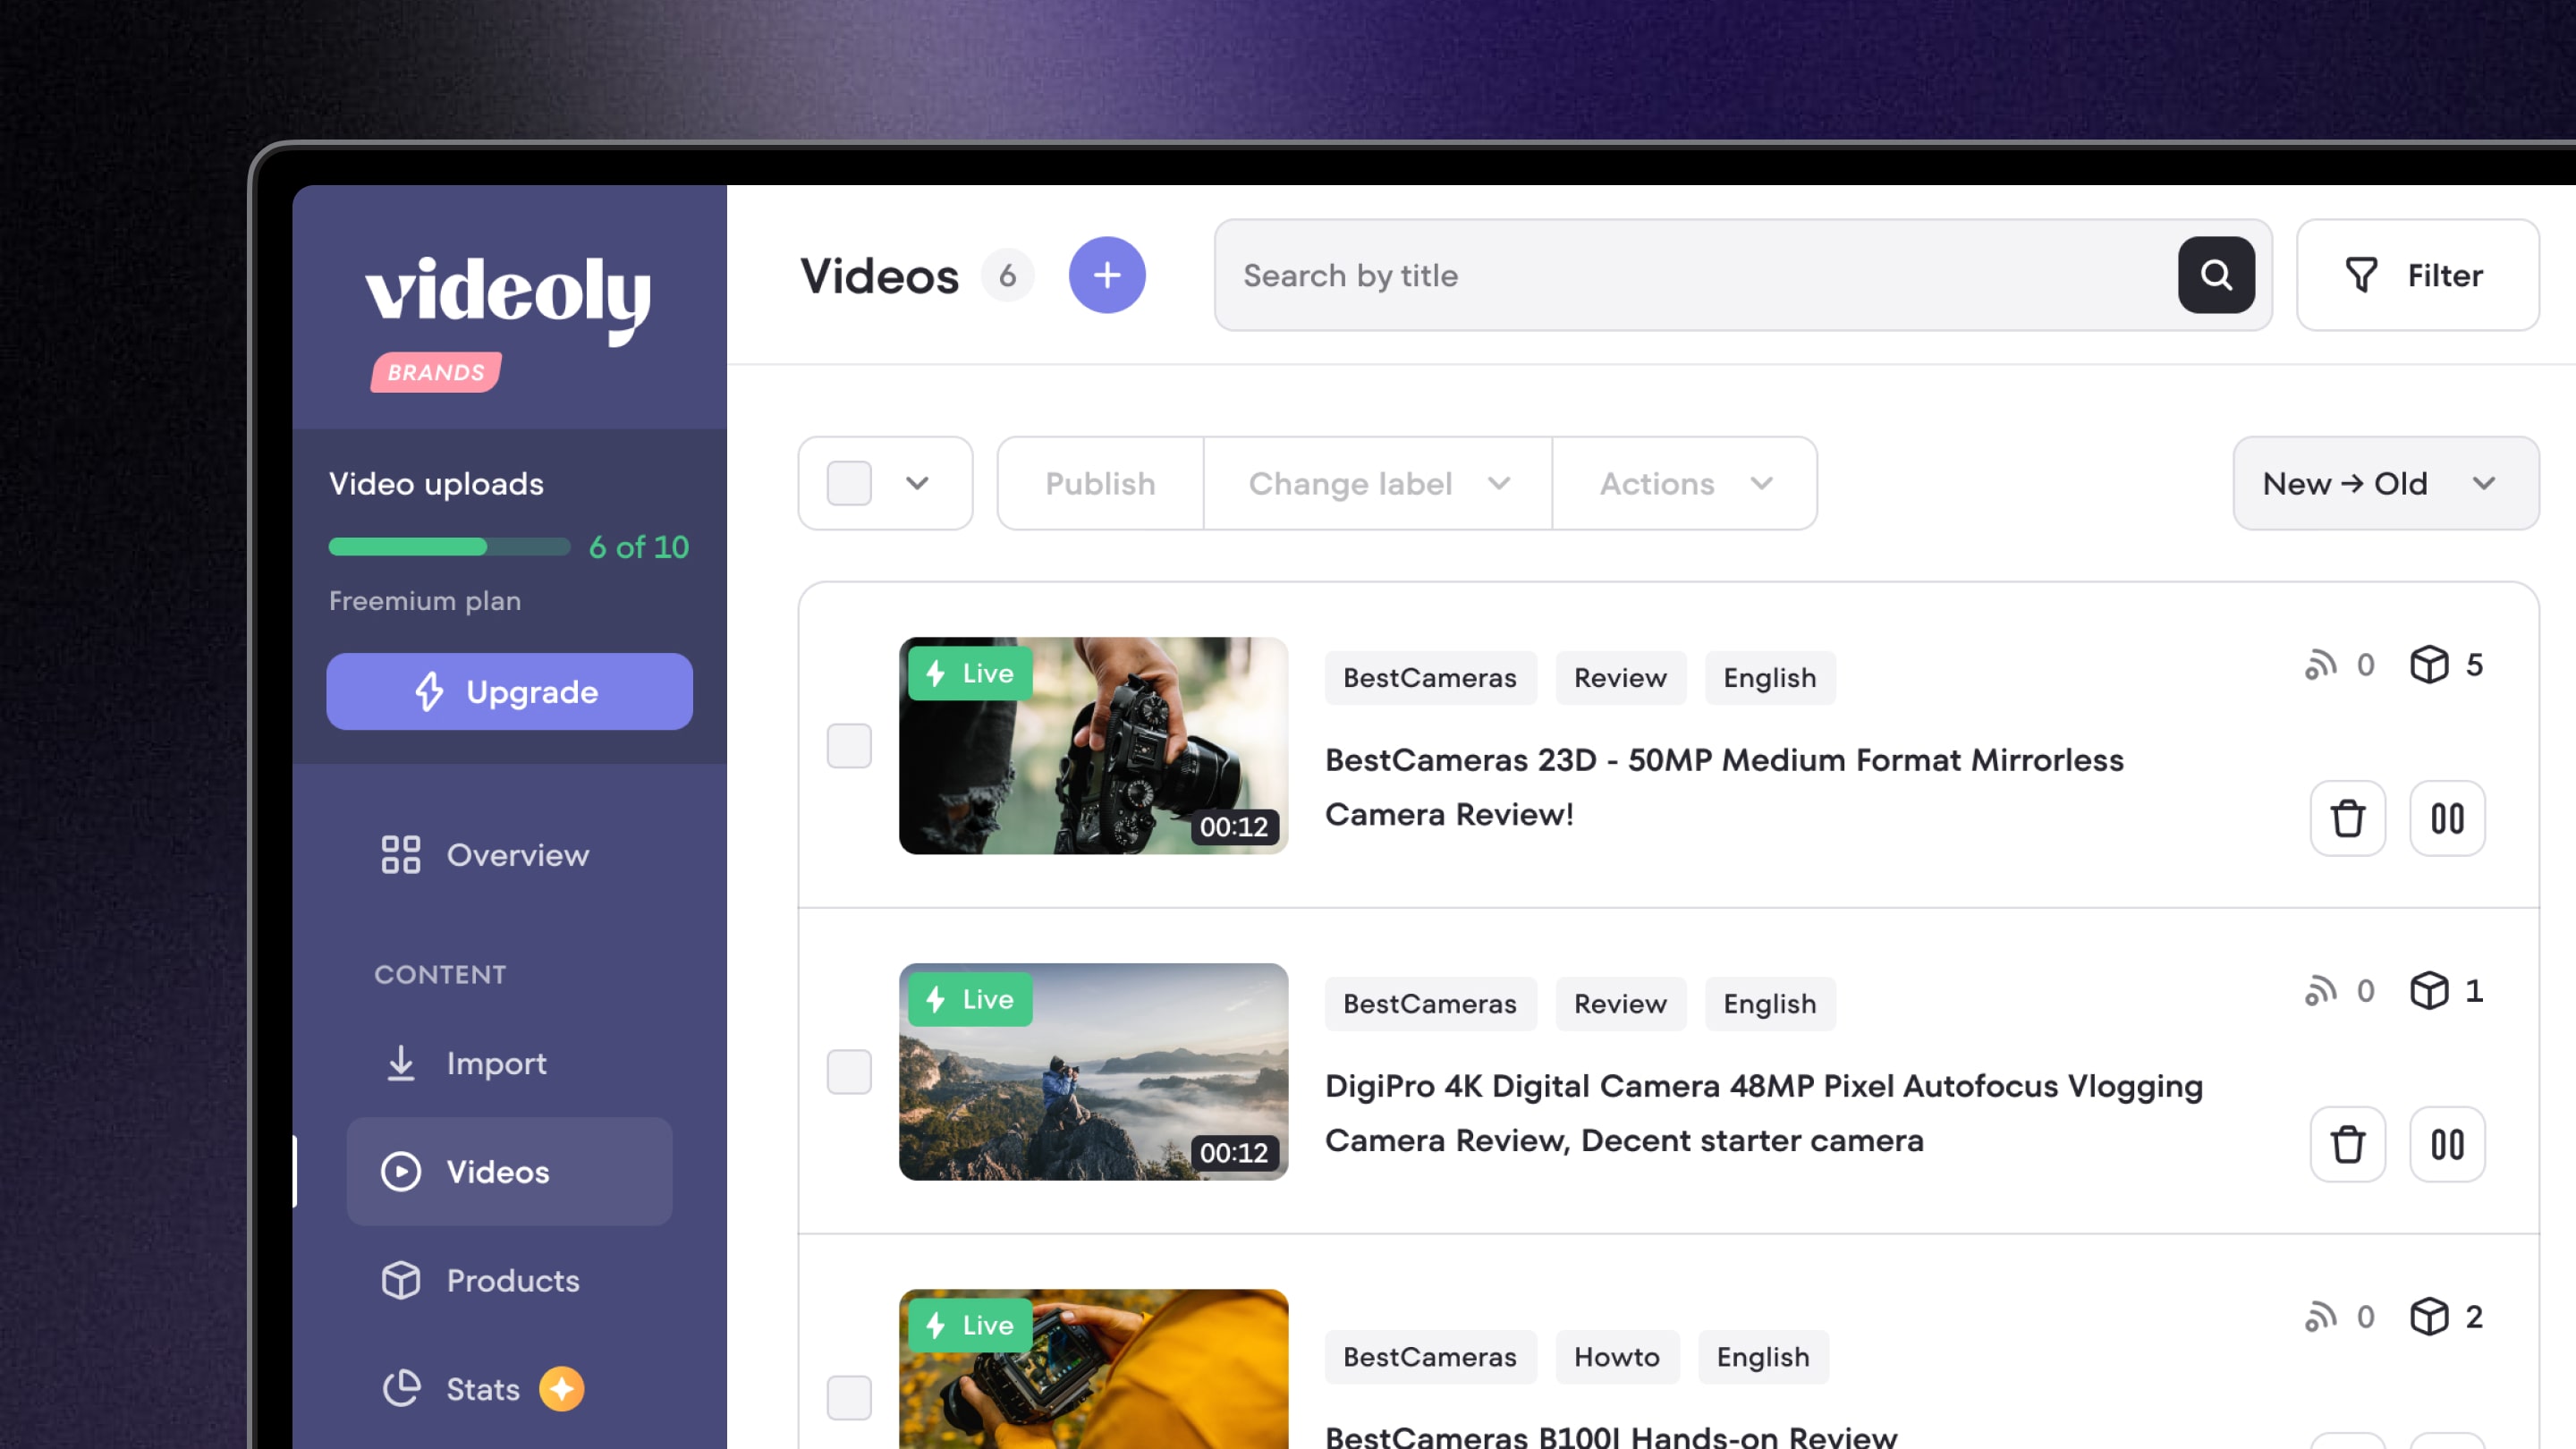
Users wanted to understand the number of live videos directly on the Videos page. We added main data blocks and hints to a separate panel on the right side of the content. On the video page, we added several metrics to understand how specific videos perform on linked products.
Process
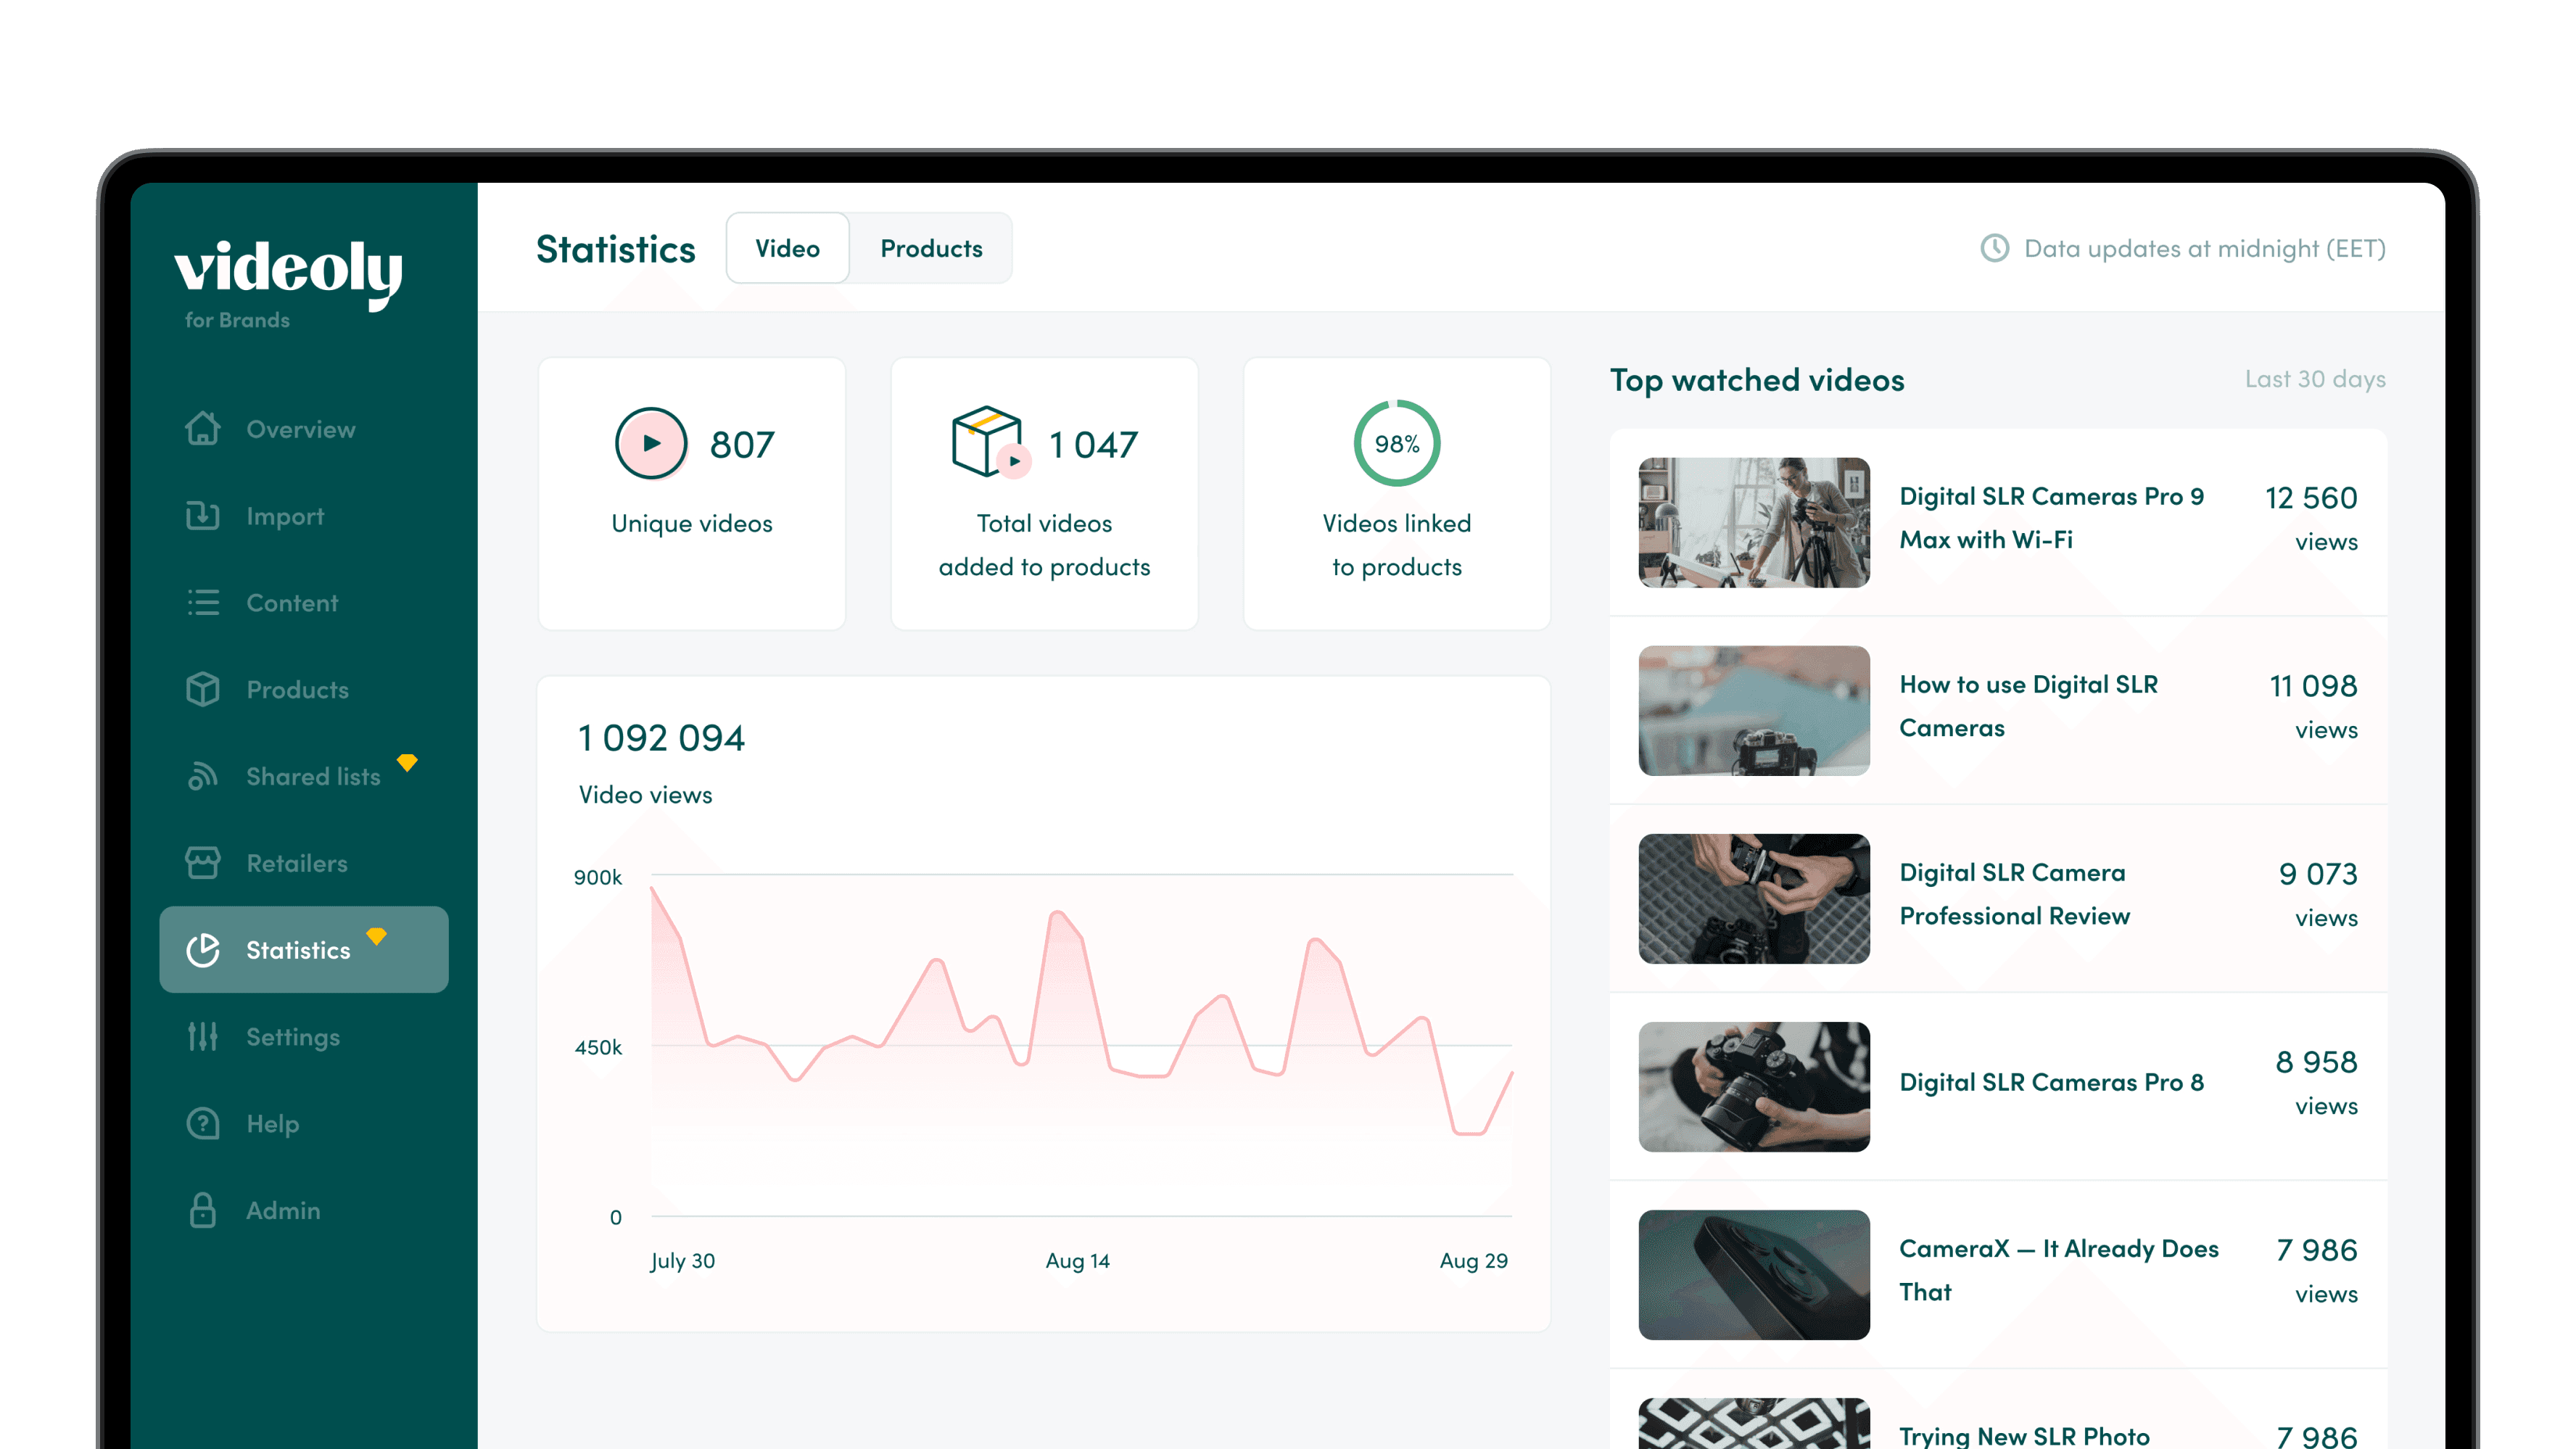
Collecting all data in one place
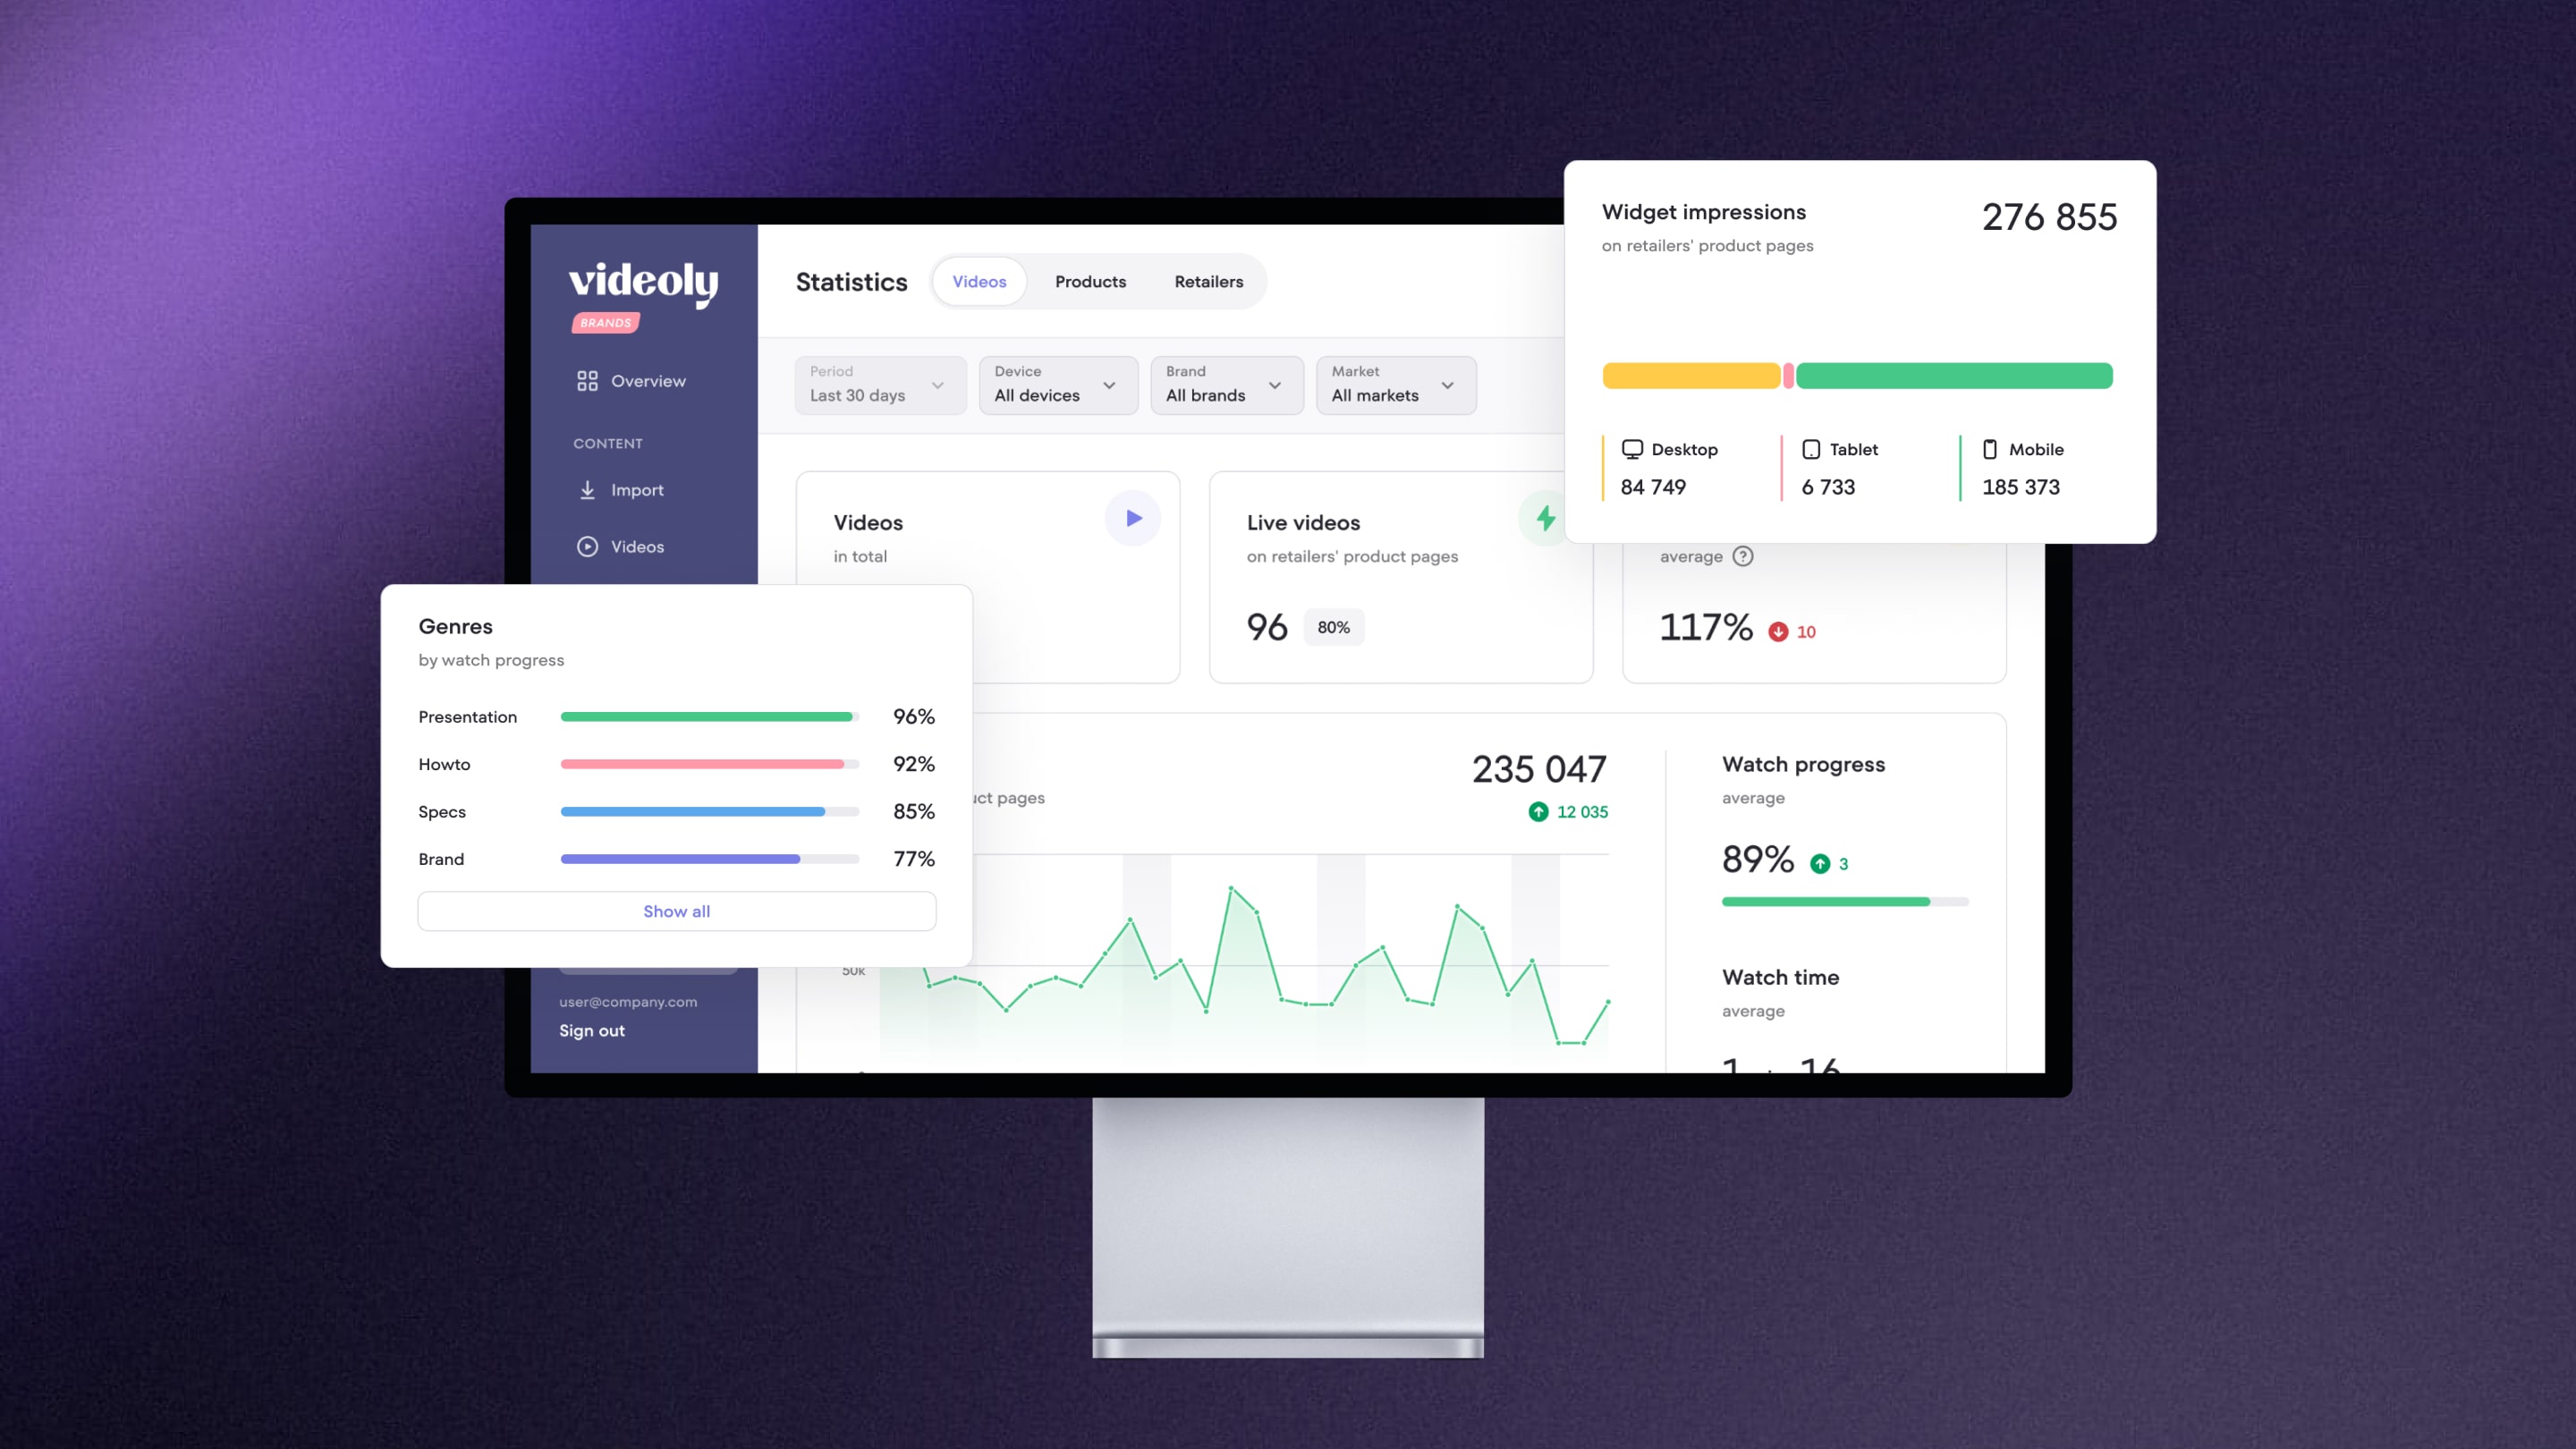
The first task was to present basic statistics on videos in a separate section. I analyzed the feedback from clients and business stakeholders and designed the layout. I proposed dividing the data into tabs.
MVP
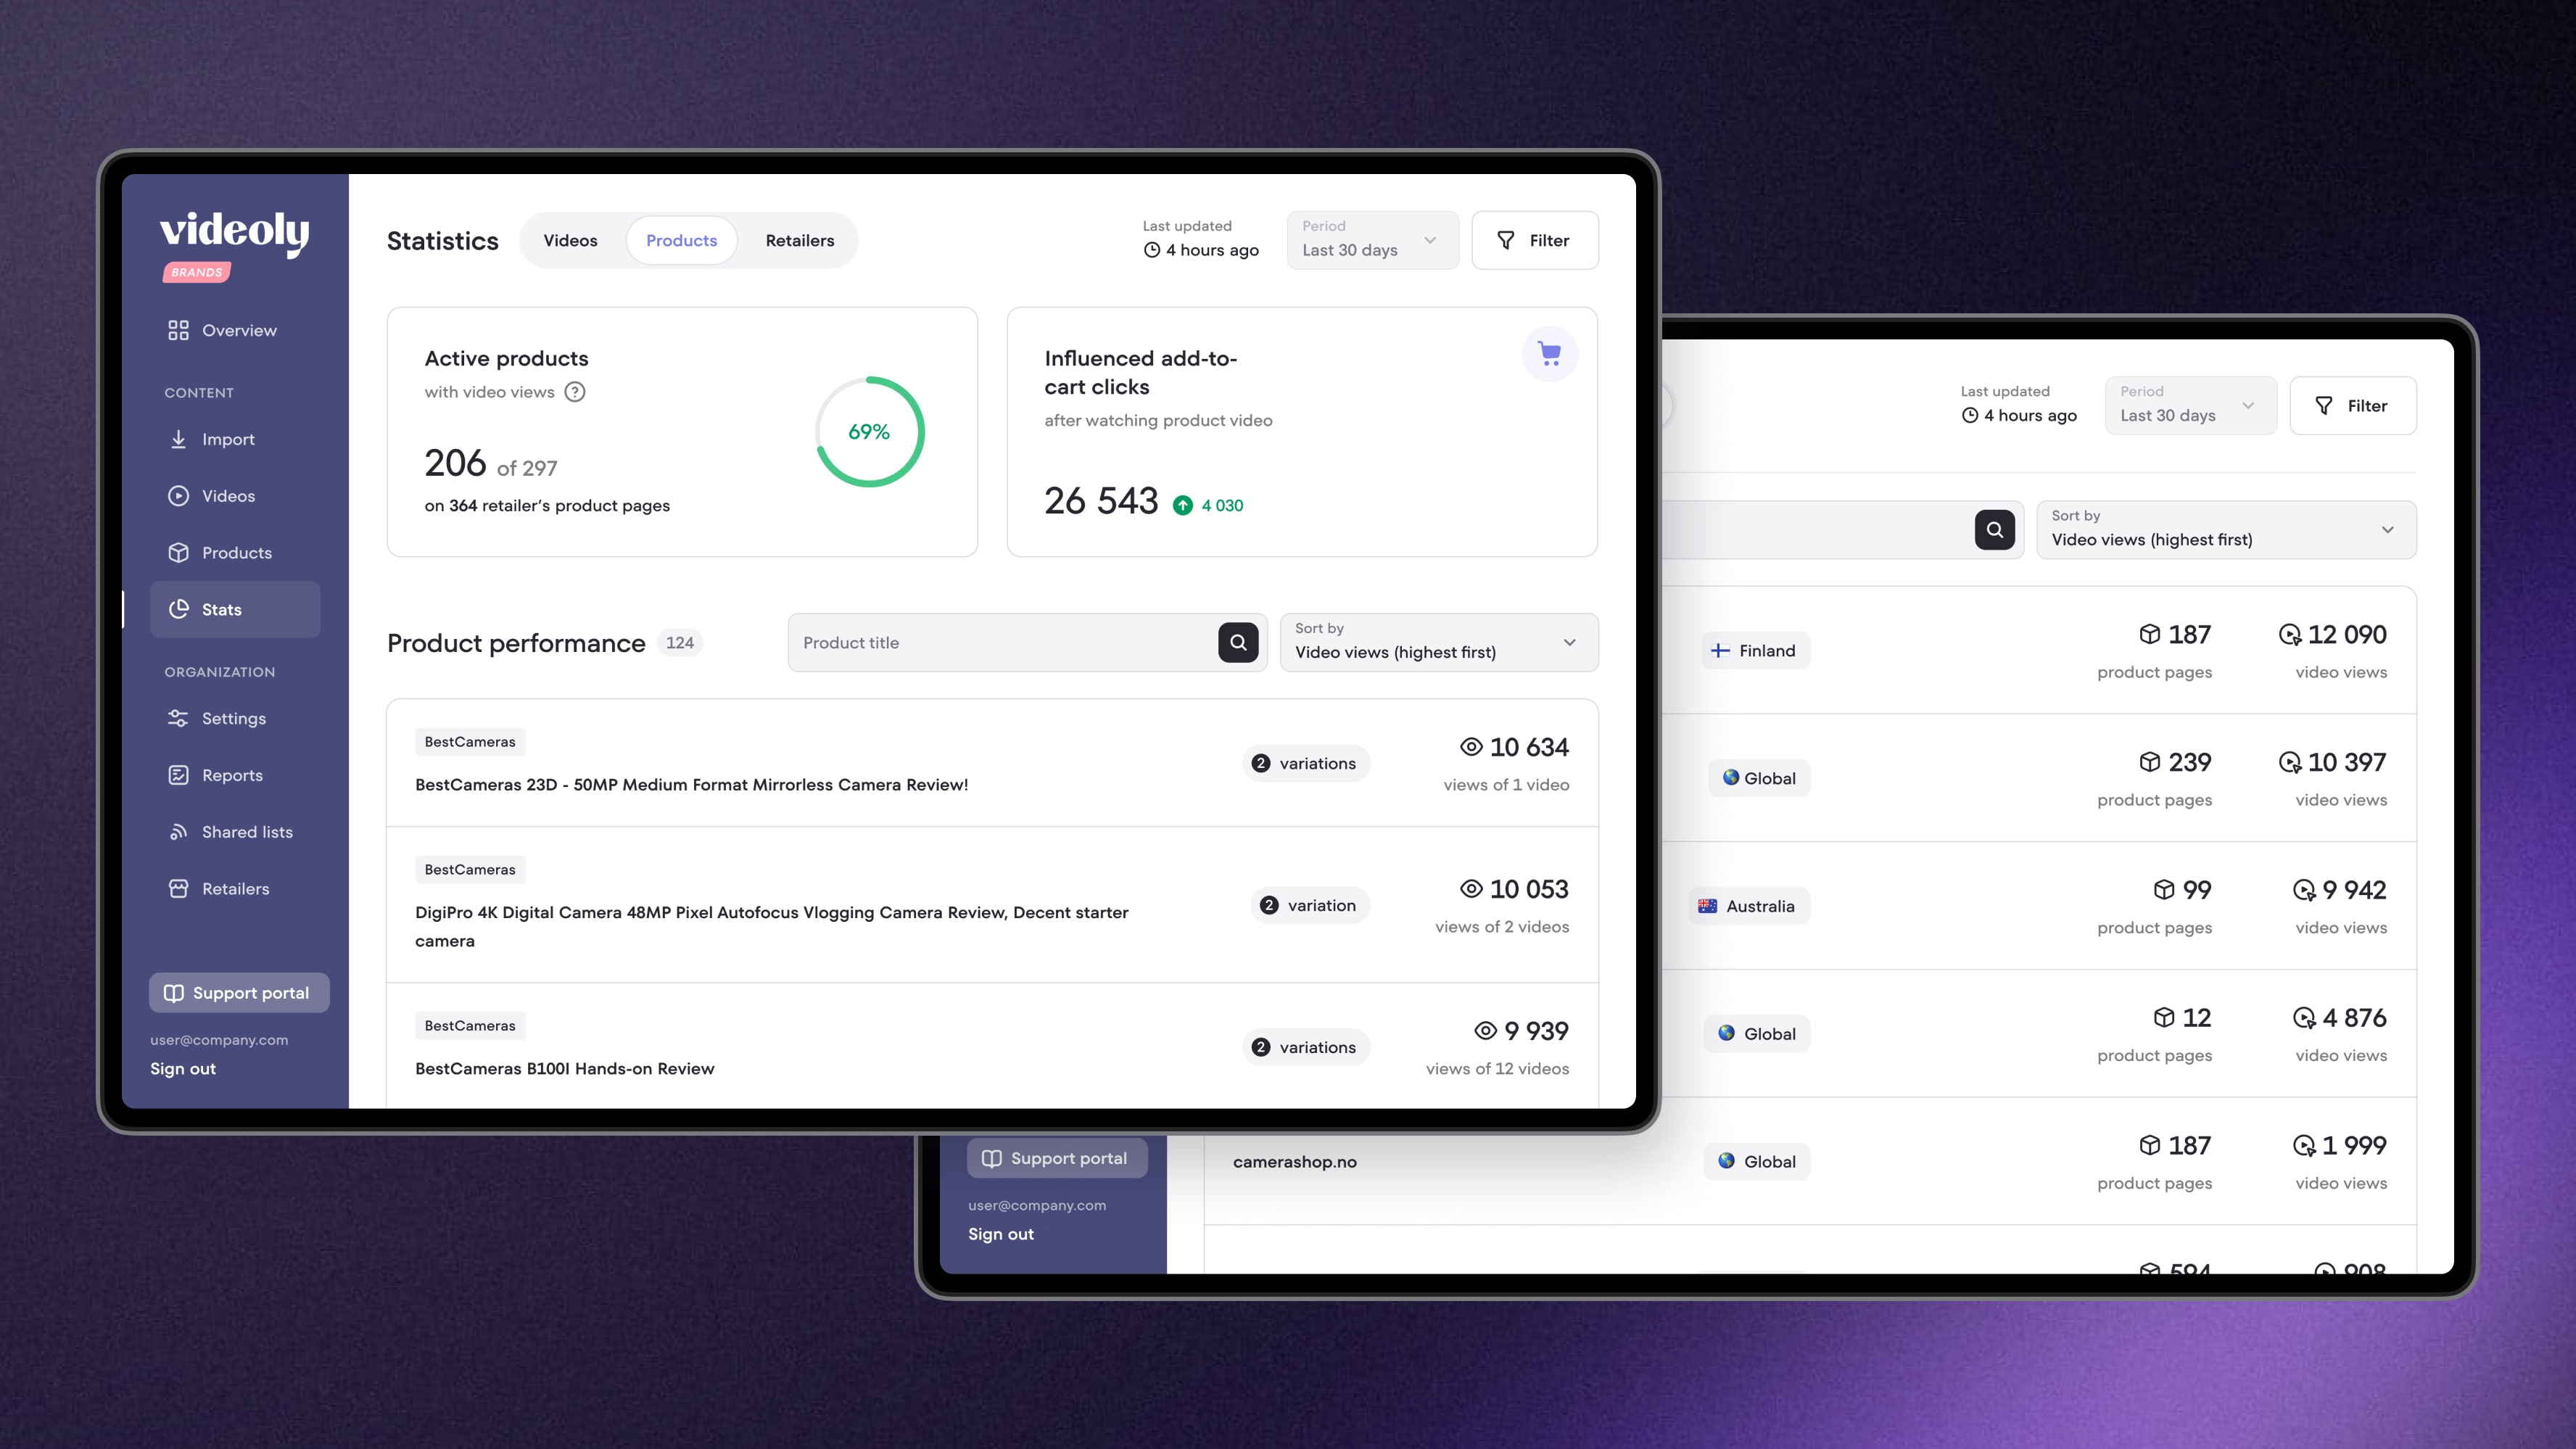
After analyzing user requests and needs, the focus shifted to gathering and presenting more in-depth data. Lists of videos and products were added along with their performance metrics. To make the user experience smoother, we integrated filters and sorting options.
Later we decided to move common filters from the popup to a convenient block at the top of the page.
Process
Delivering customer reports
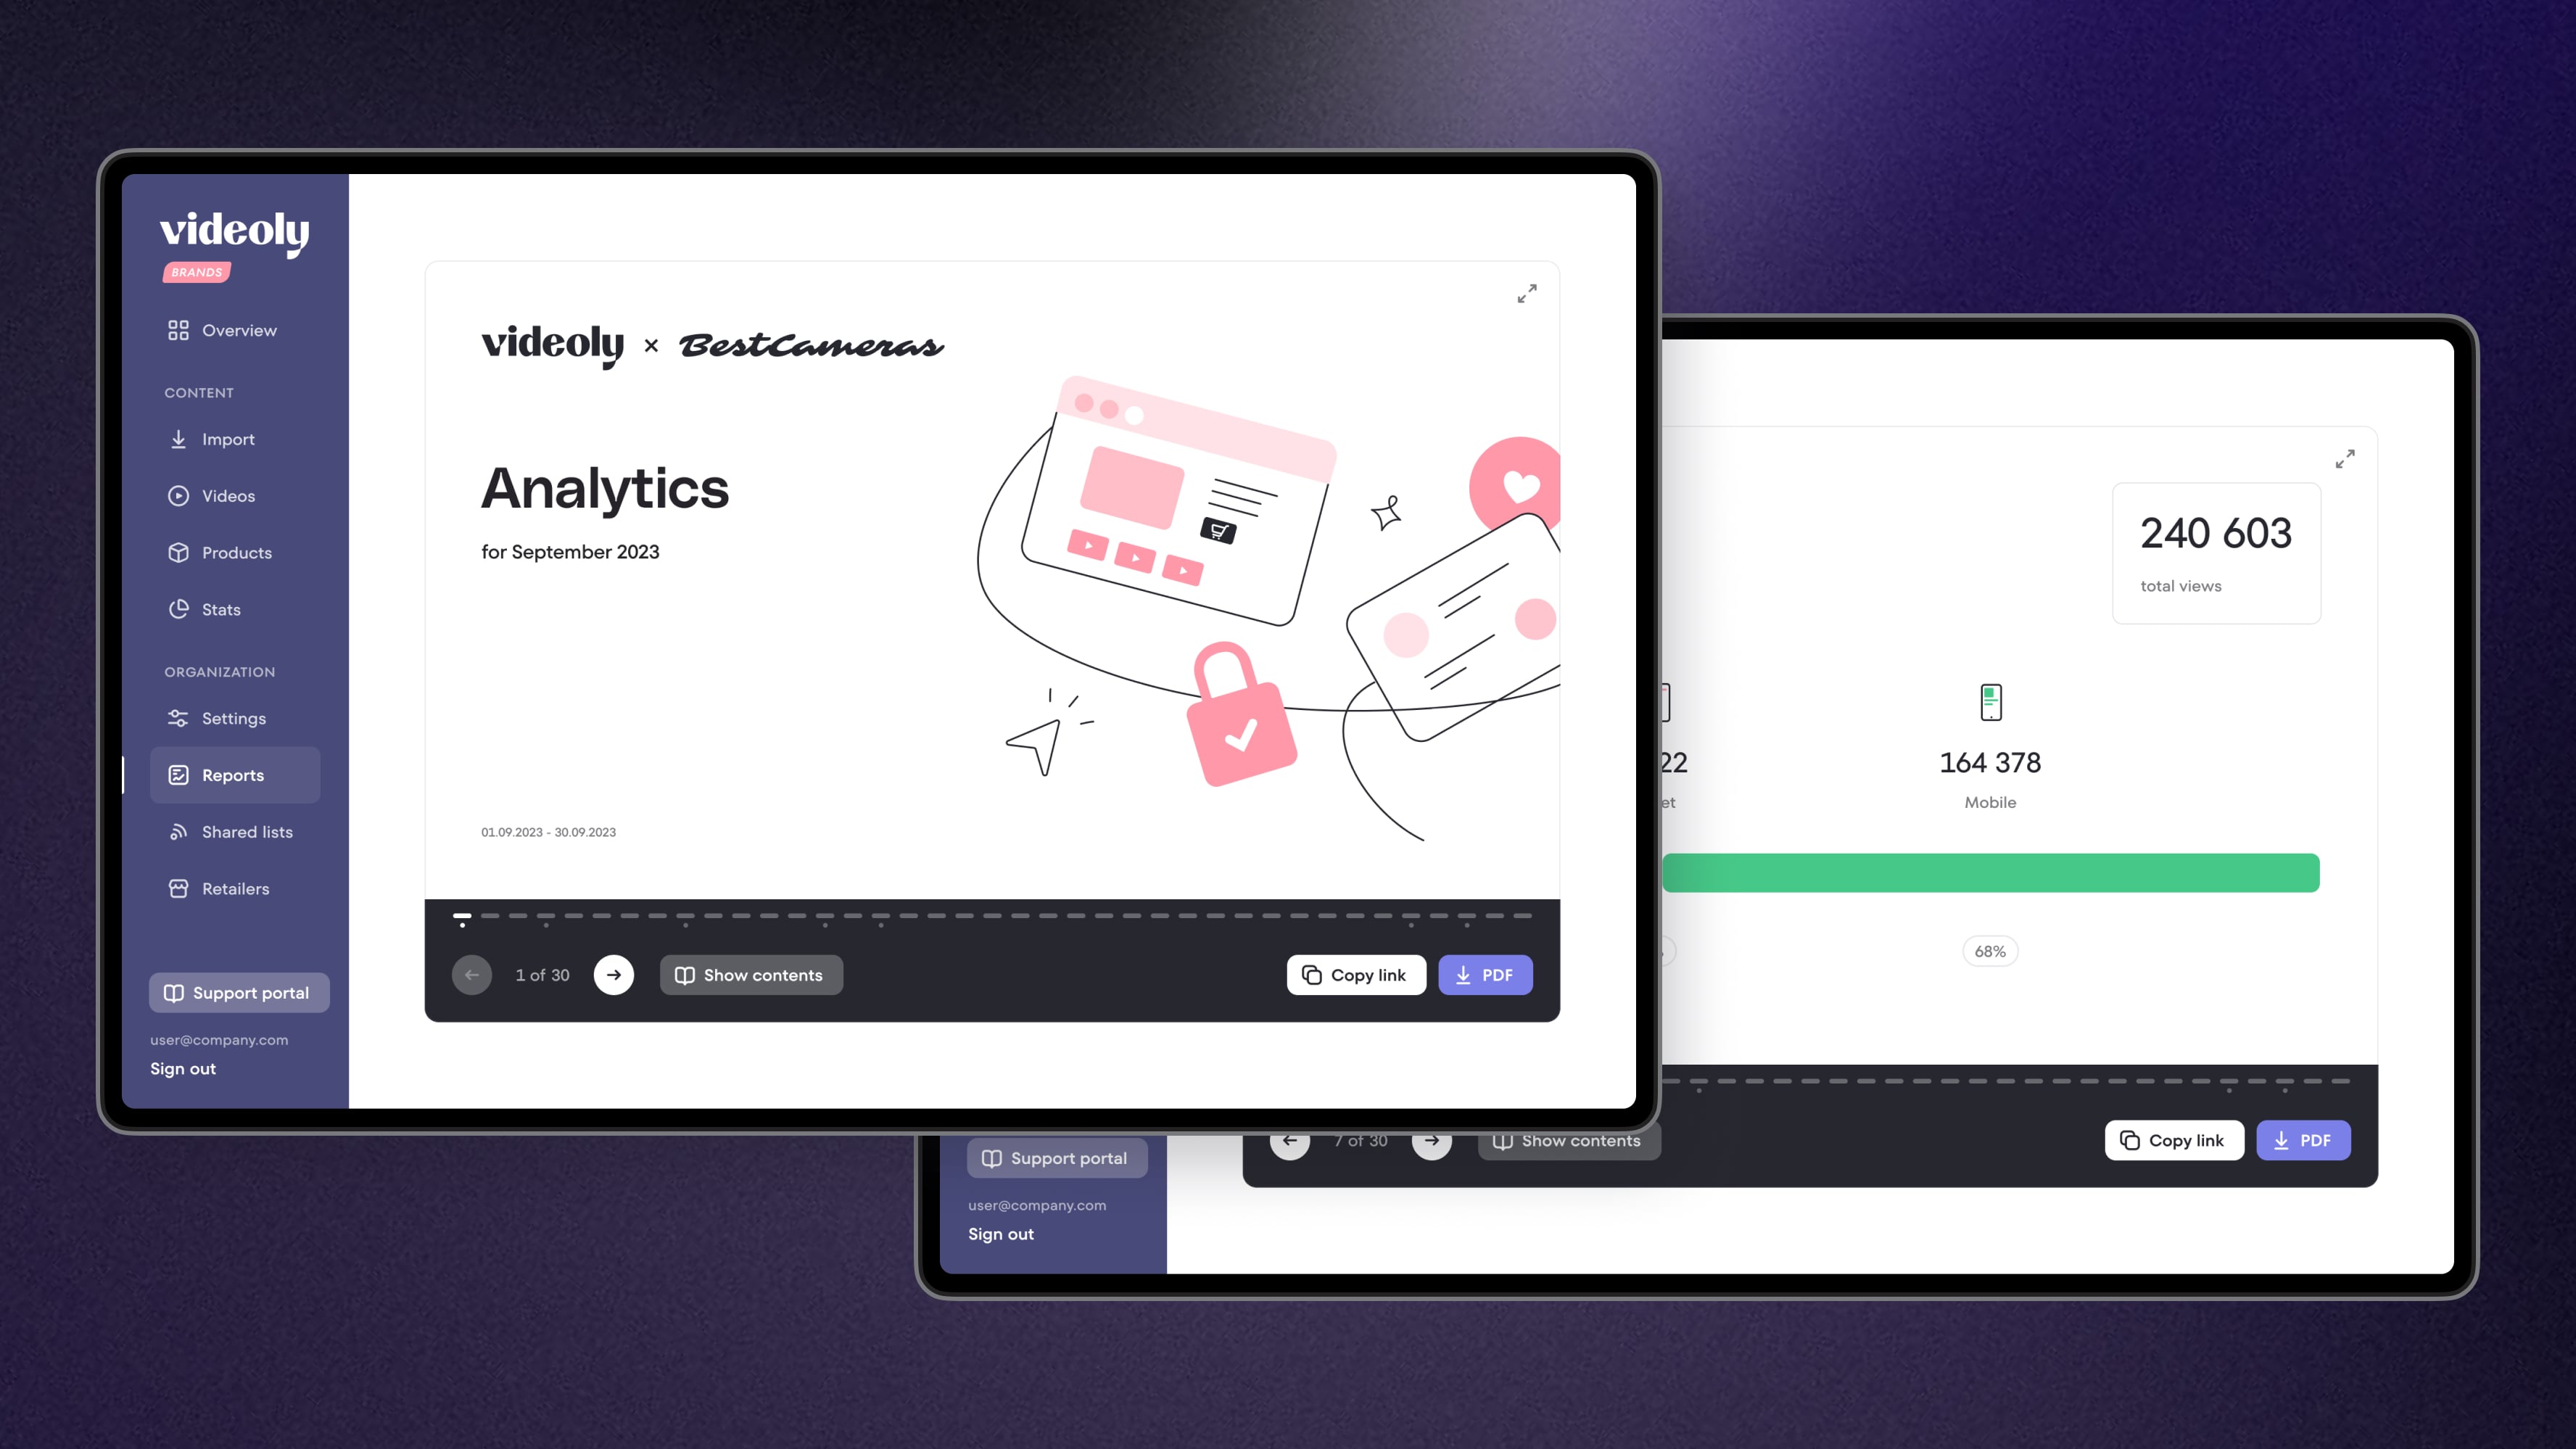
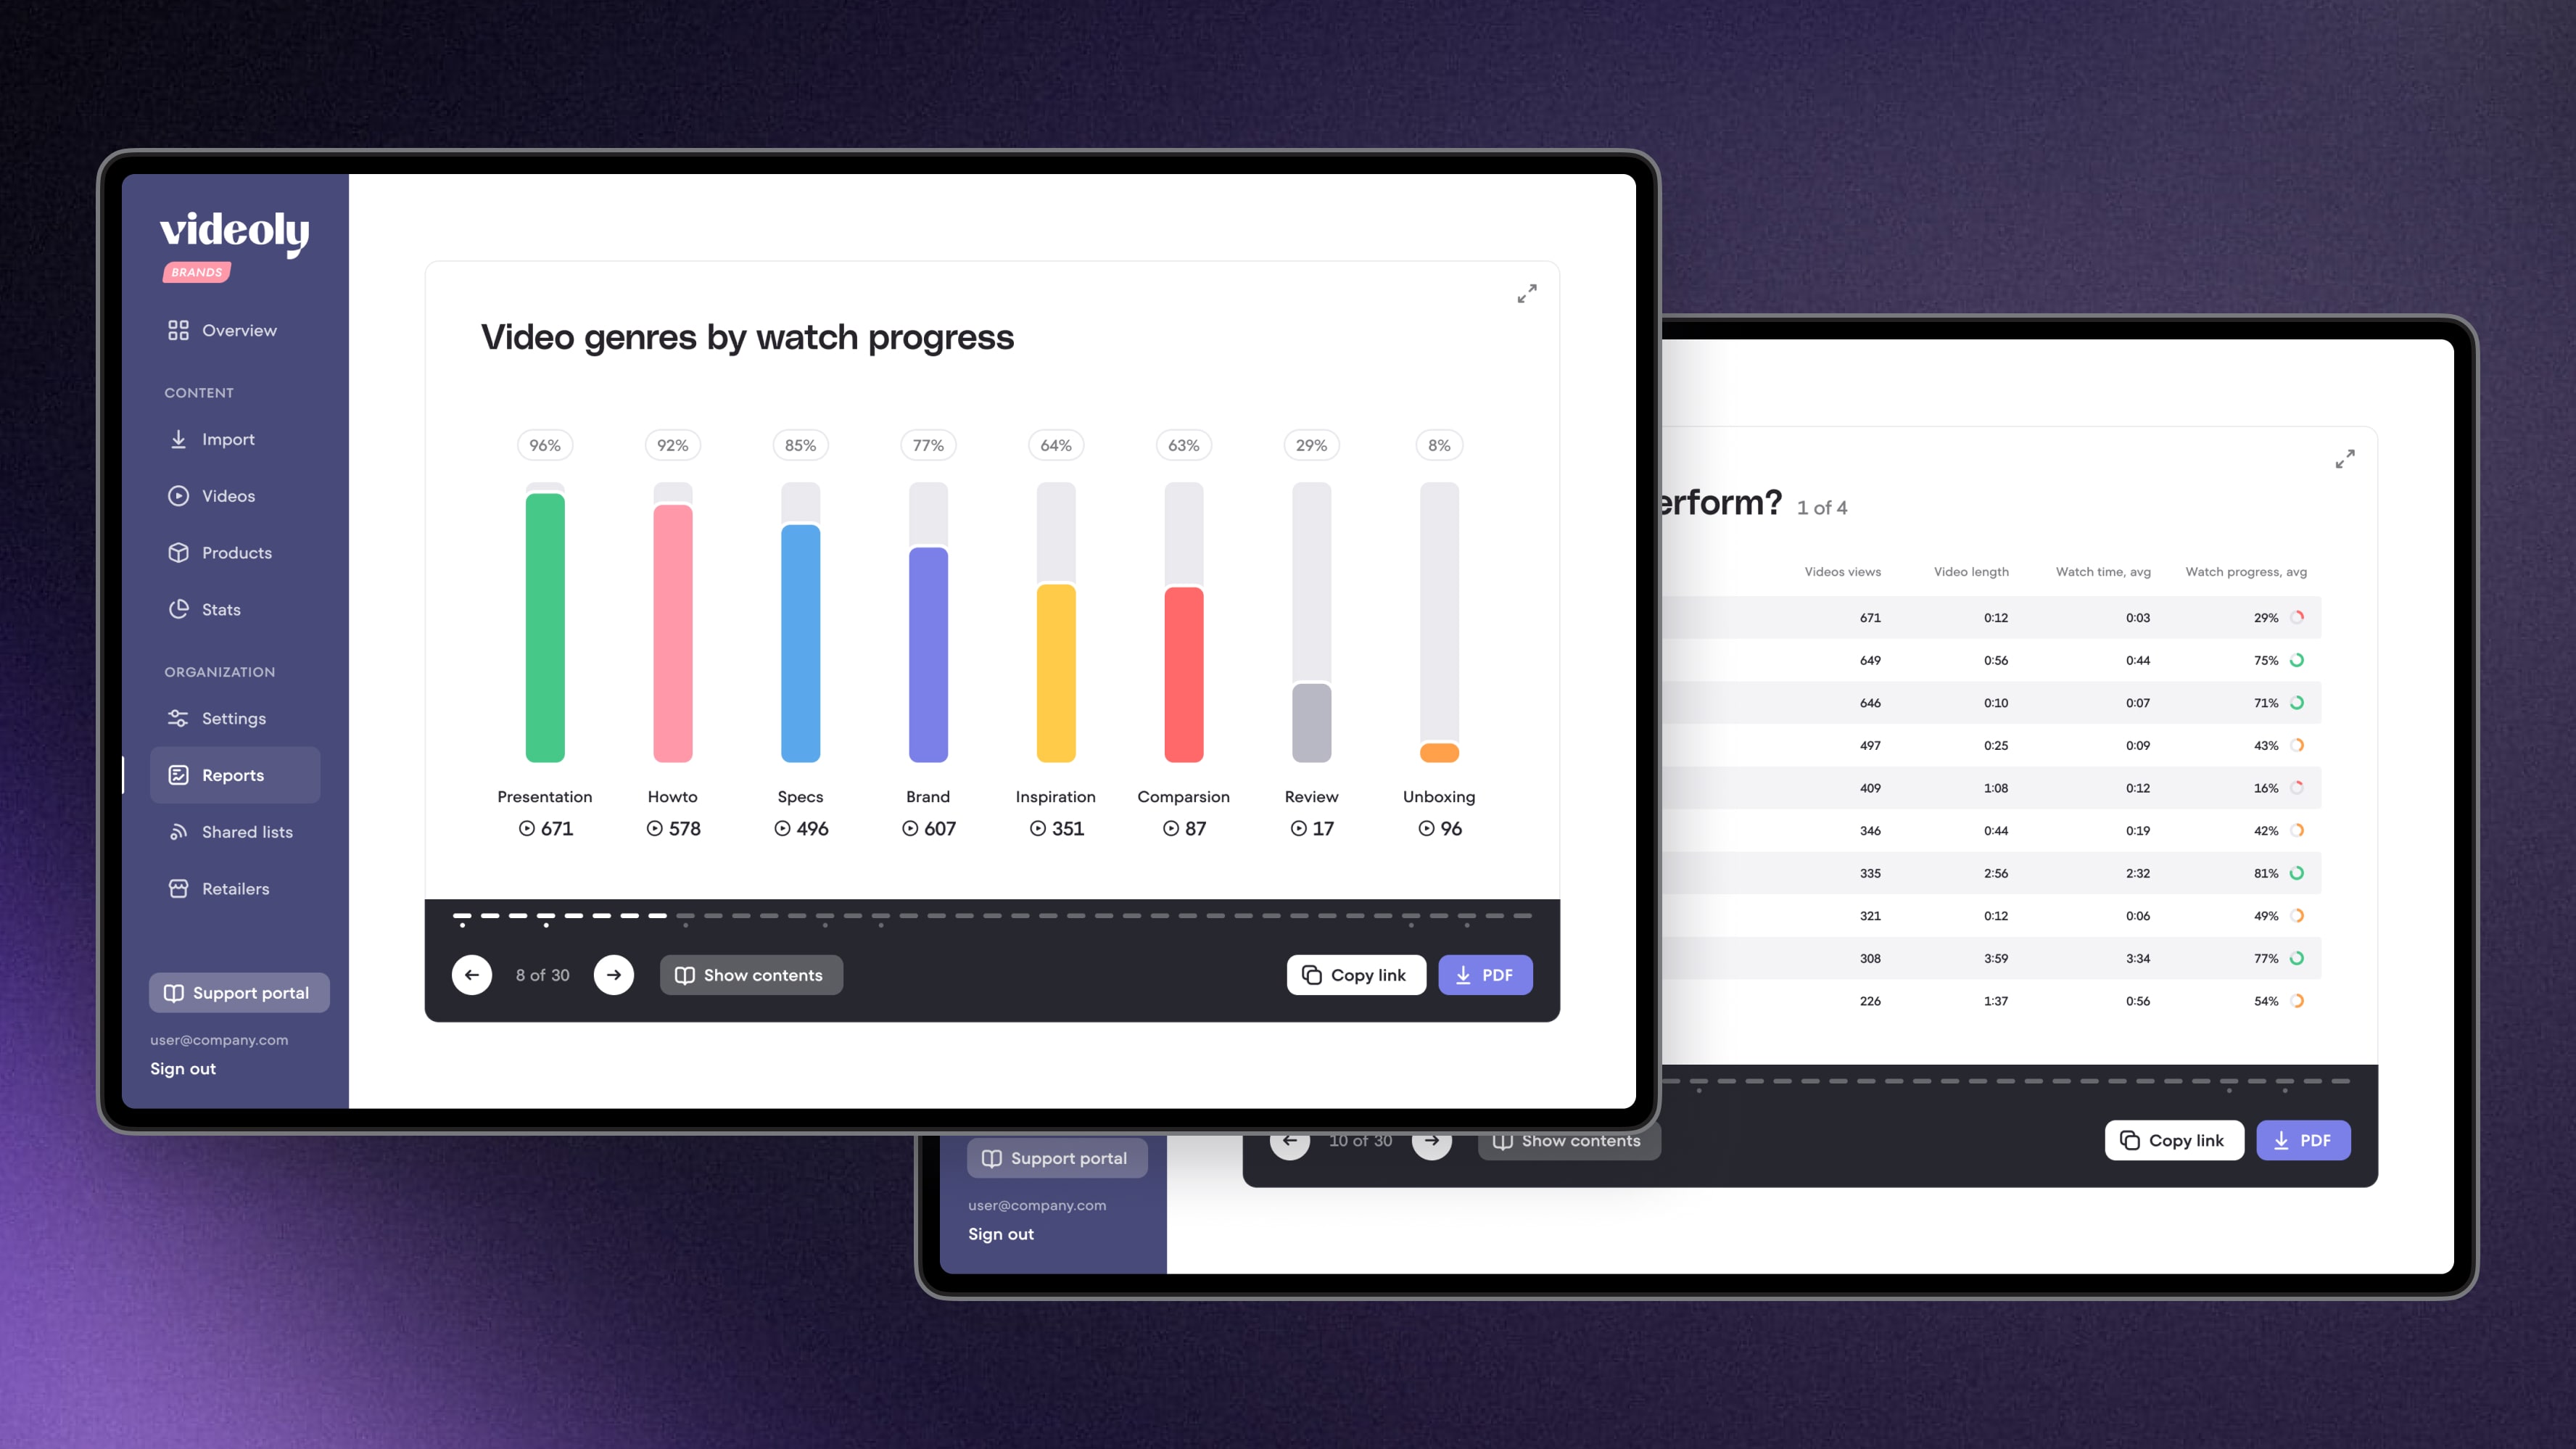
After launching Videoly for Brands, clients wanted to receive reports in a format convenient for them - separate PDF files. Reports were manually compiled by managers and sent to clients via email. Often, they were difficult to locate in the correspondence after some time. For user convenience, was implemented a separate section with monthly reports.
Later, reports were automated. I proposed viewing reports directly within the Videoly interface using an interactive player in addition to downloading a PDF file. However, due to tasks of higher priority, implementing the player was postponed for the future.
Results
Displaying the current distribution status of brand videos and presenting in-depth data in a separate section allowed users to better understand which video content works best for their products. Automatic monthly reports facilitated communication with brand representatives and demonstrated Videoly's effectiveness. We received positive feedback, and business stakeholders were satisfied. These solutions helped establish relationships with new clients and potentially reduced churn for current clients.
Throughout the process, we secured significant clients such as Polar, Lumene, Electrolux, and Nordlux. Another notable achievement was winning the L’Oréal Nordics Innovation Day 2022 – a competition where groundbreaking startups pitched their solutions to beauty industry leader L’Oréal.
1st place
Winner
L’Oréal Nordics Innovation Day 2022
REVIEWS
4.9
overall rating on G2.com
